Abstract
An analysis of how bicycle rider numbers and behaviour are affected by climatic and other factors, using data from Transport for London combined with weather data from Open Meteo.
The effect of temperature on rider numbers is looked at first with expected results, followed by the effect of wet weather which does not produce a linear regression. The reasons for this are investigated.
The proposition that COVID made cyclists hardier and less sensitive to bad conditions is then studied.
Finally the data is interrogated to see brown fat build up during winter months would increase the numbers of riders in cold weather at the end of winter compared to the start of winter.
The cycling data produces clear correlations except in the case of the brown fat analysis.
Overview
I’ve been riding a bike in London since 1993 so looking at a Transport for London dataset of bike trips was pretty much inevitable. Clearly rain and cold are what put off most people from riding year round, but how much difference does it make? Did the pandemic and avoidance of public transport make people hardier? And does brown fat make 5 degrees C feel warmer in February than in November?
I chose the Central London TfL data as I wanted to look at commuters. They are (mostly) consistent in having to make a journey five days a week, but get to choose which mode of transport they use to make that journey.
The Central London data is collected from 210 sites. Let’s look at the broad picture.
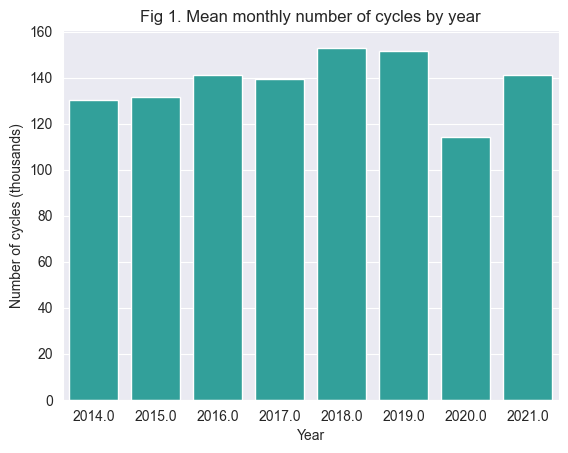
We see that total cycle trips – which combines private cycles and public hire bikes – by year shows an upward trend until the start of the pandemic.
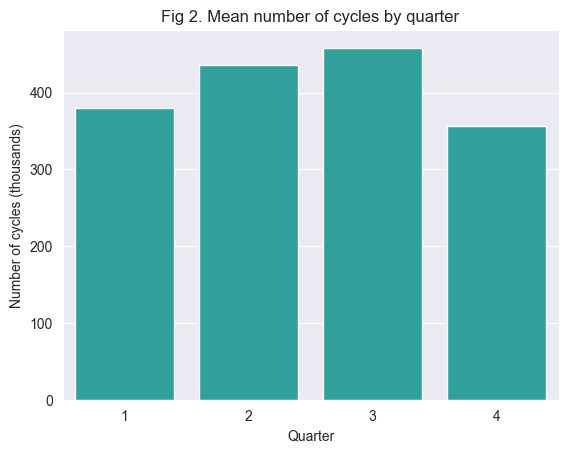
The quarterly total cycle figures show an expected pattern also. So we can start to look in more detail.
I want to see how temperature and precipitation affect rider numbers, so I got hourly weather data from Open Meteo to merge with the TfL info. The TfL data had a column for ‘Period’, with the ‘AM peak’ running from 07:00-10:00, so I chose to use the corresponding temperature at 8am. Open Meteo uses a system of numerous weather codes, but most of the TfL entries were label either ‘dry’ or ‘wet’ so I could use those with some cleanup. I then filtered by weekday and AM peak to give me the required morning rush hour data from the 210 Central London locations where counting was carried out.
Cycling and temperature
Clearly temperature affects the number of people deciding to ride to work but by how much?
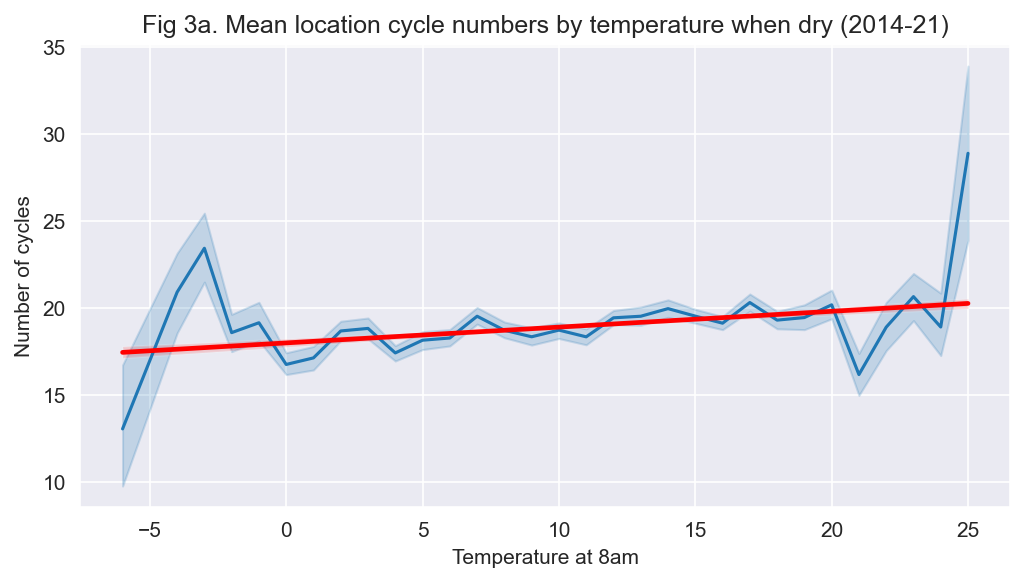
The is linear relationship evident from the regression. Personally I find it just too cold to want to ride a bike any significant distance when the temperature falls to zero and thought there might be a population-wide point where numbers drop precipitously, but this is not the case – some people are oblivious to frozen fingers and others real fair-weather riders. Over a 20 degree change in temperature there is a 9% increase in cycle numbers.
Are people that use hire bikes less ‘hardy’ than those that own their bikes? If this were the case we would expect to see a steeper line for the hire bikes.
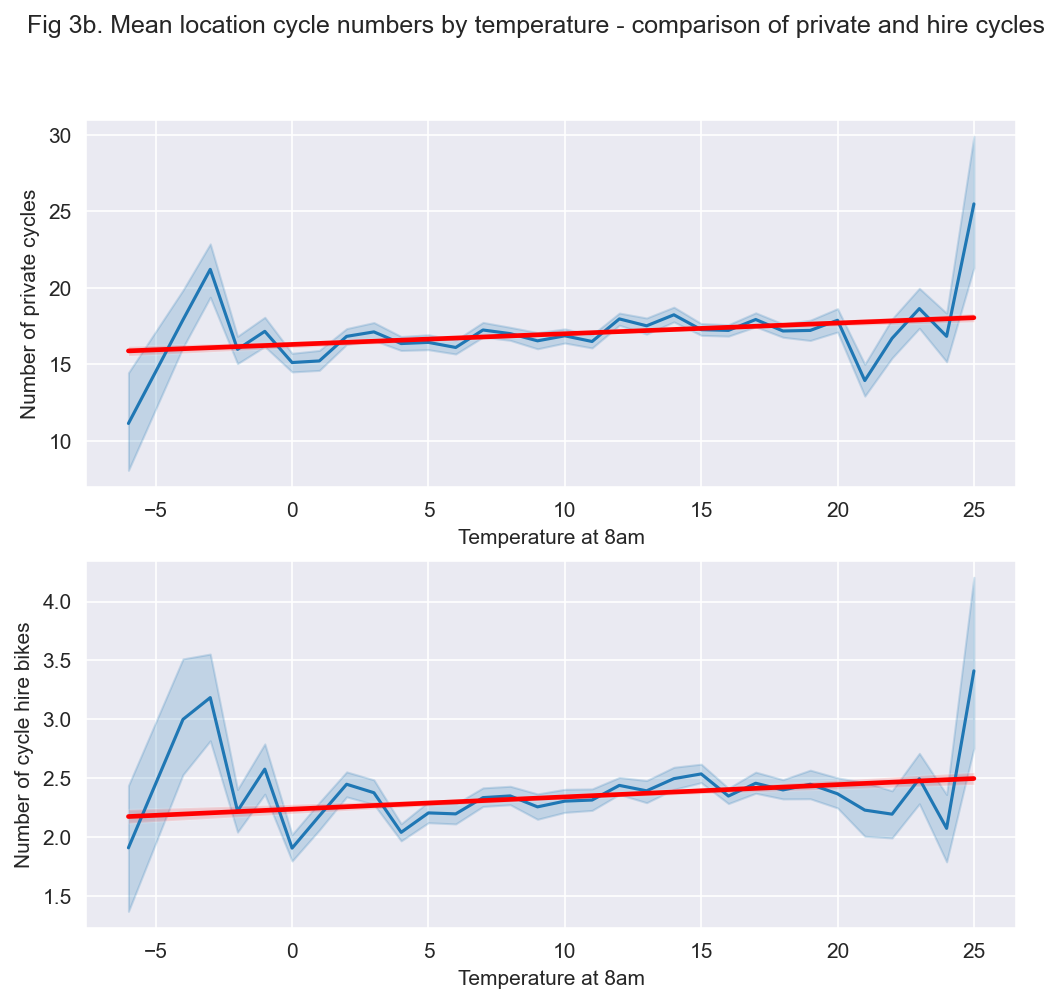
The plots are very similar except for different rider numbers, so behaviour hardly differs between the two groups.
Cycling in wet weather
Rain used to stop me riding whatever the temperature, that is until I got full waterproofs after which it makes almost no difference. But the majority of people will just think it better to take the tube, so I figured that rain would have a much bigger impact on rider numbers.
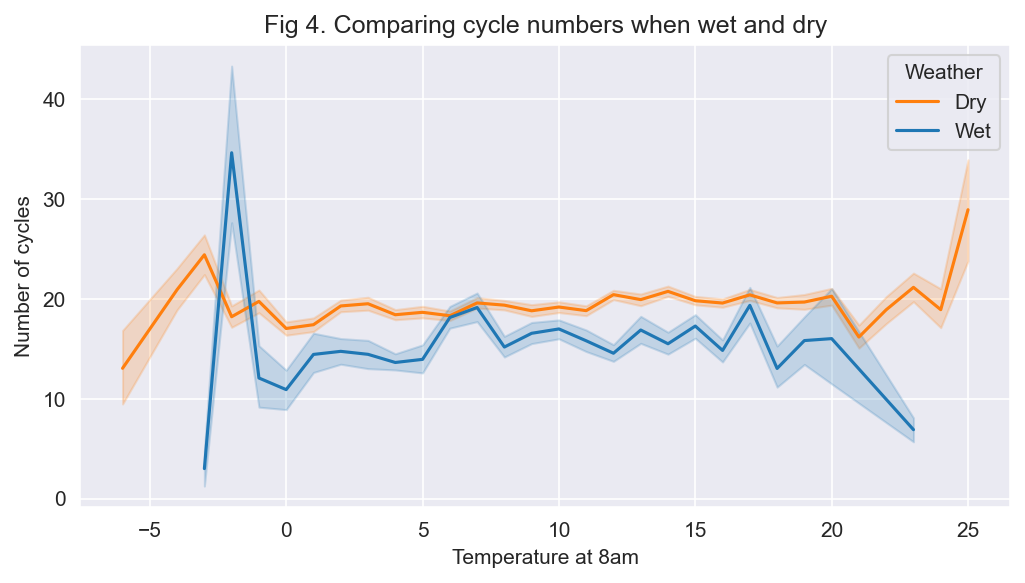
Definitely a substantial drop, but another difference is that in wet weather rider numbers don’t rise linearly with temperature. Let’s take a closer look.
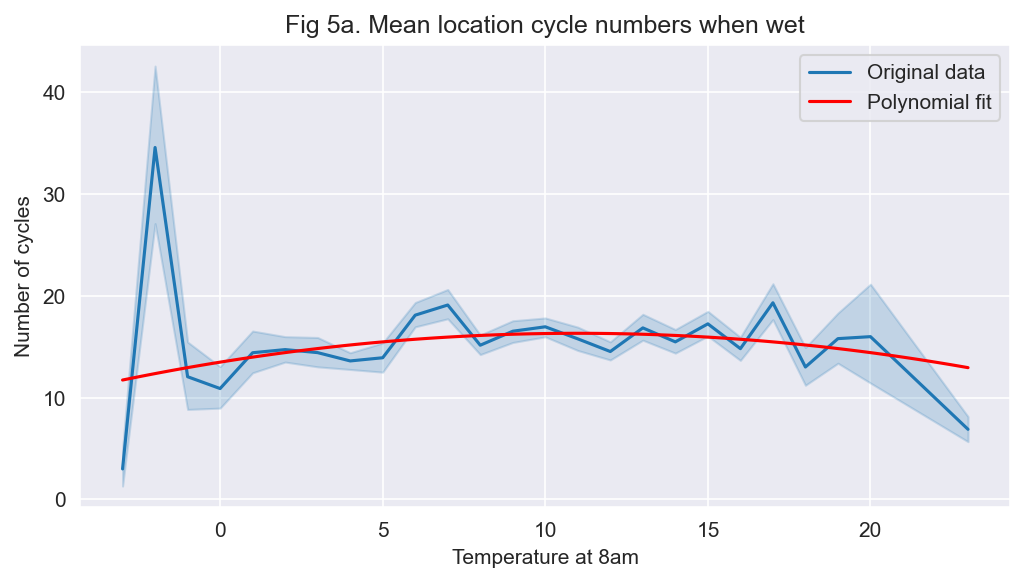
This suggests that the number of cycles varies with the square of the temperature, but it doesn’t seem correct that there is one simple reason for this. At lower temperatures it’s understandable that the combination of cold and wet would be more off-putting together, but what about at high temperatures? Could it be that the intensity of rain increases, to produce heavy downpour type rainfall?
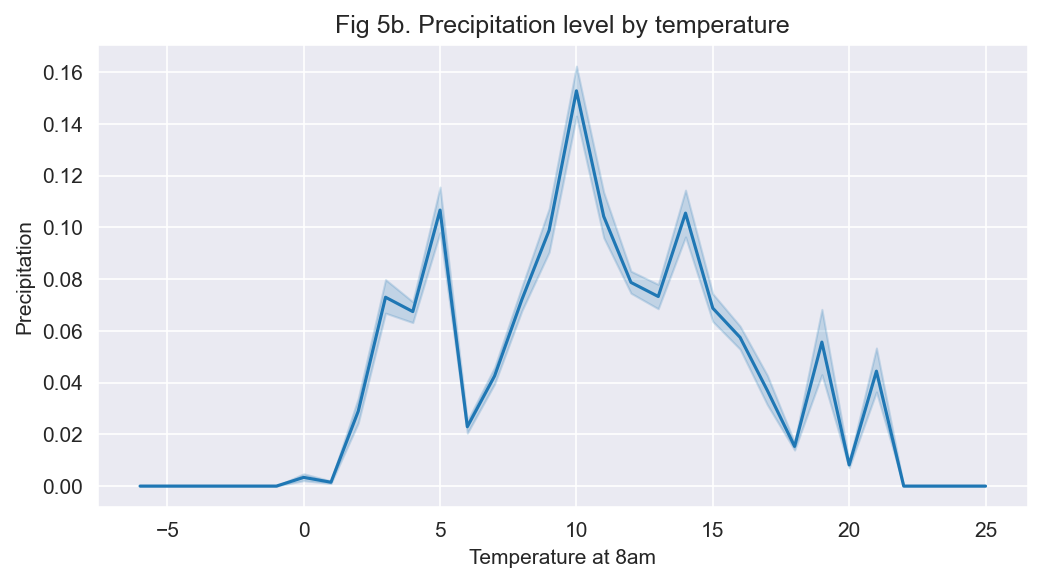
The intensity of rain falls off at higher temperatures after peaking at 10 degrees, so isn’t the answer. Another explanation could be that wet days when it is hot are wet not just because of precipitation, but also because of perspiration – it’s hard not overheat when the weather is hot and humid, plus not many workplaces have showers.
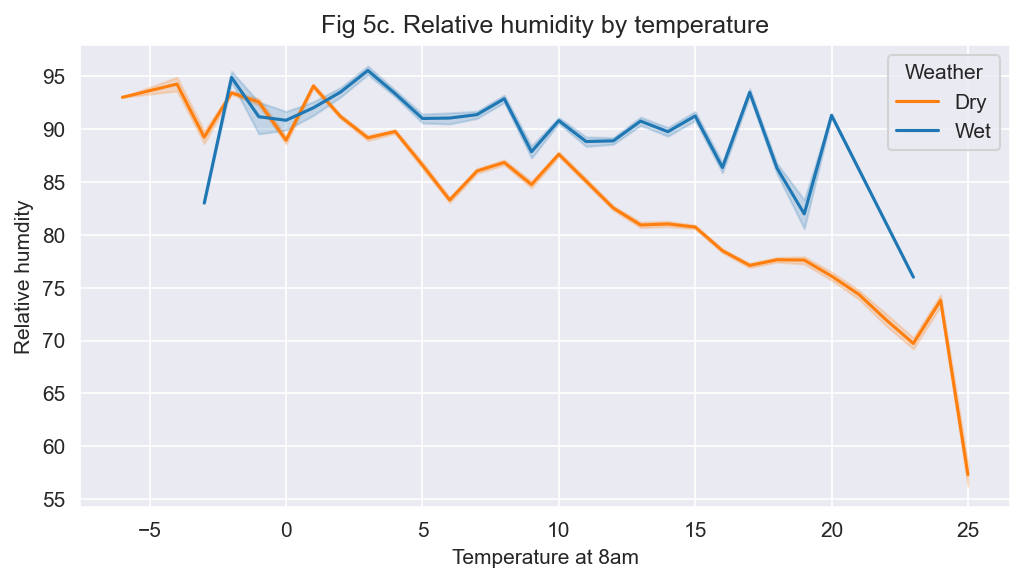
The relative humidity is higher on wet days than dry and the difference becomes more marked at higher temperatures, so this could be an explanation.
Let’s compare averages across all wet and dry days. The average of Total cycles for all dry days is 19 and this number drops by 4 on wet days, so a 22% decrease. (For some context to this figure the TfL data gives conditions for each 15 minute count and has a number of descriptors. I included any that indicated that it was actually raining at the time, such as ‘light rain’ or ‘drizzle’, but did not include those that indicated intermittent rain, like ’showers’ or ‘light showers’.)
So wet weather cuts rider numbers by 22%, whereas the change in rider numbers over a range of 20 degrees is 9%.
The comparatively large effect of rain can in part be explained by there being more than seven dry days for every wet day so there is not a big incentive to investing in waterproofs, which are sometimes imperfect and then have to be dried out at work.
Also cycling commutes in London are likely to be easily replaced by public transport, which becomes the least hassle option. But the same is probably not true for motorbikes and mopeds where distances travelled can be much greater. It would be interesting to compare figures for these groups and also figures for a city with poor public transport.
Cycling and COVID-19
The first bar chart above shows the effect on overall cycling numbers of the pandemic; a large fall in numbers in 2020, with 2021 still not back to the 2018 and 2019 figures. The year on year drop in cycling was 32.5%, however the number of passenger journeys on the London Underground dropped by 77.9% (financial year figures). Some tube passengers did switch to cycling as reported by TfL.
Again looking at my experience, I completely avoided public transport for over 18 months, preferring some short-term discomfort of bad weather over potential exposure to COVID. It could be expected that others would make a similar choice. To test this I have plotted how cycle trip numbers change with temperature for 2019 and 2021.
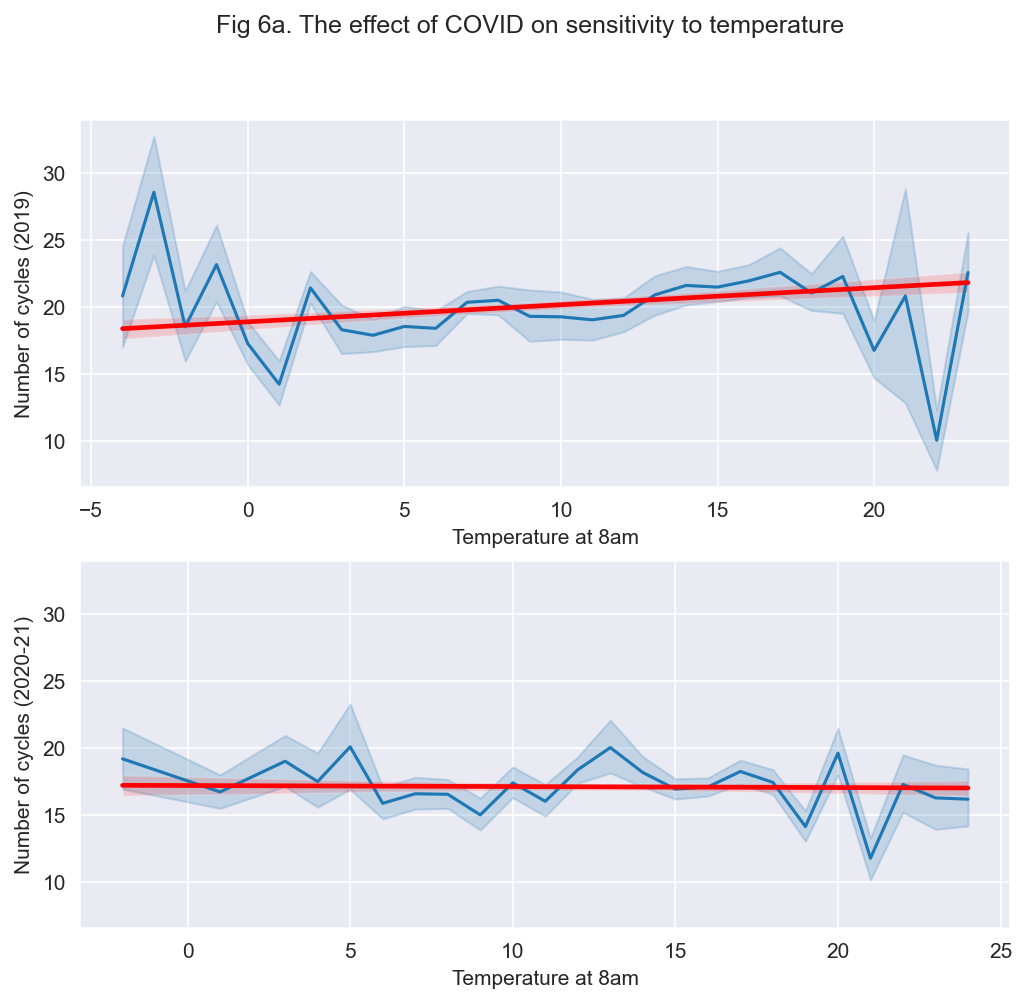
Comparing the effect of temperature on cycling before and during the pandemic the absolute numbers are not so important, though of course are lower in 2021 as more people worked remotely. What is more important is the angle of the regression line – the 2019 plot shows a typical pattern with a significant drop in cycling as it got colder. By contrast the line for 2020-21 is nearly flat, so people persisted in cycling with the same drop in temperature.
Looking at the numbers of riders on rainy days shows a similar trend in the fall of the mean numbers of riders on rainy days compared to dry days with the same temperature.
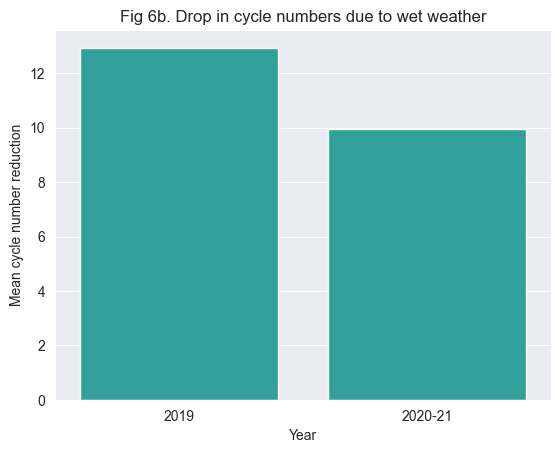
The bar chart shows that post COVID there was a smaller drop in the number of cycles, meaning that during the pandemic 23% fewer people were put off cycling by the rain compared to the year before the pandemic.
Cycling and brown fat
I watched a Vox report on brown fat and how it makes the same air temperature feel cold in the autumn and warm in the spring, as the amount of brown fat in the body increases with exposure to cold and brown fat is used in thermoregulation to produce heat. This makes a certain temperature feel cold in the autumn, but the same temperature feel warm in the spring as the body has produced more brown fat during the winter as an adaptive mechanism.
I thought that the cycling data could be a good illustration of this and so have plotted the counts of cycle trips against temperature for the last three and first three months of the year. The expectation being that for a given temperature there will be more trips at the end of winter.
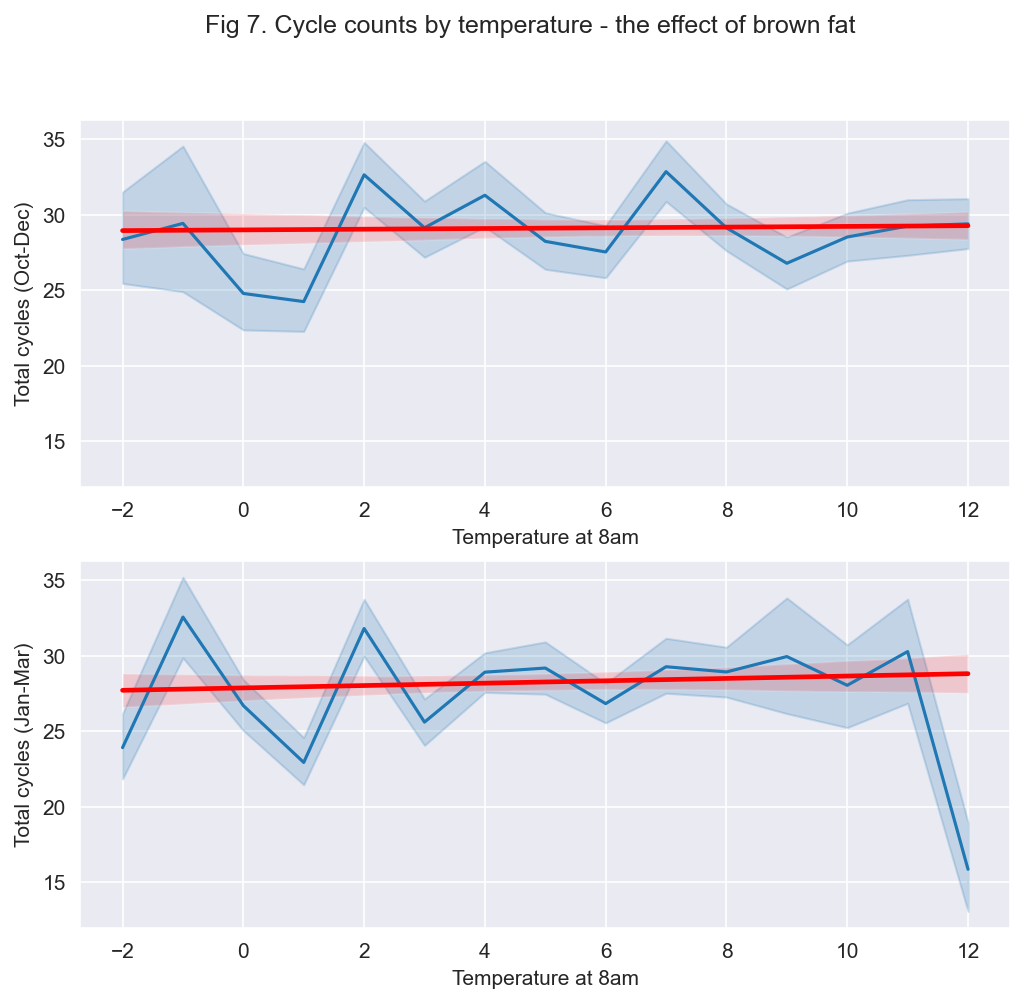
There is very little difference between the plots and they actually show a slightly higher number of cycle trips at the start of winter than the end. So any effect of brown fat is not visible in the data. It could be that city dwellers spend so much time inside heated buildings that they are not exposed to the cold enough to change the amount of brown fat their bodies produce – it would be interesting to plot similar data pre and post the start of the war in Ukraine, as people turned thermostats down in response to energy price increases. It could also be that any effect would be small, so that an extra layer of clothing would be enough to counter it.
The fact that there are in fact a slightly larger count of cycles at the start of winter is probably down to inertia in people’s habits; they continue riding through autumn until they are forced off their bikes by bad weather, perhaps by rain as much as temperature. And in the new year it takes them a while to get out their bikes and start riding again as the weather improves, essentially ‘missing out’ on some days that are objectively good cycling-weather days.